By Dheeraj S | July 30th, 2020

Content engagement scoring is one of the most effective ways of quantifying content marketing performance in the digital world that we live in today. Pageviews, average time on page, etc. are all valid data points, but to do justice to all the hard work that goes into producing quality content, a much more holistic model needs to be established. This model should consist of specific metrics and also some kind of a numerical rank based on these metrics so that we can compare different pieces of content on a like-for-like basis.
Previously, we have already discussed, how to improve content quality and also the qualitative checklist associated with the same and now, in this article, we discuss the basics of content engagement scoring scheme which is majorly quantitative. The method outlined here is entirely conceptual and can be easily adapted for any business with context-specific tweaks.
Engagement vs. Performance metrics
Understanding this distinction is essential to measuring engagement correctly. Content can be produced both for generating conversions (e.g., landing pages) and also for creating engagement (e.g., information blog posts where the objective is to convey domain authority and not so much to solicit an explicit conversion action). The metrics you select should be based on the primary measurement objective. For example, tracking the avg. time on page for a landing page is hardly actionable, given that you optimize a landing page to capture leads and not to increase dwell time.
Understanding the building blocks of content engagement scoring
While selecting the right metrics is essential, this by itself is not enough. If the idea is to be able to compare content items, then we need objectivity, we need numbers. We can think of a content engagement score as a combination of two components
- The numerical value of a metric-This is the metric value normalized to a scale. For example, if content item A has an average time on page of 600 seconds, while another one has 10 seconds, then we can normalize these values to a scale of 1 to 100 (or some other arbitrary range). This will also help in consistently including metrics that have different measures (e.g., number of link clicks, percentage video views and so on)
- The weight assigned to that metric-Each metric should ideally have a different weight when using a score consisting of multiple metrics.
These two components can then be combined using some kind of a weighted average formula, which results in a single, numeric score for every item. The process for content engagement scoring now becomes a 3 step method as shown below
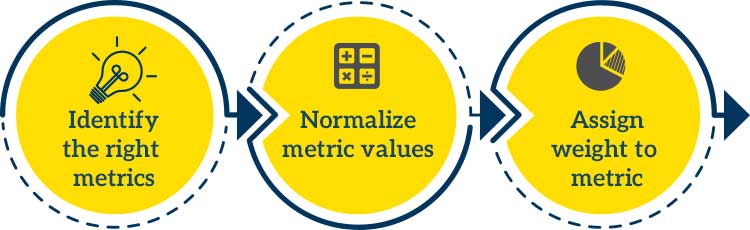
3-step method for calculating content engagement score
We discuss each of these steps in sections below.
1-Identifying engagement metrics
Before we dig into the specifics of scoring formulae and normalizing techniques, let’s review some of the more common engagement metrics used by marketers and analysts.
Avg. Time On-page
This one is a no-brainer. The higher this value for a content item, the more is the likelihood that prospects are finding value in it.
Scroll depth
This metric tells you how engaged is the user and how much of the content has been read. The higher the scroll depth, the better is the content engagement. A scroll depth of 100% with one minute of total on-page time indicates that the user just had a glimpse of the article and did not connect with it while a scroll depth of 75% with considerable on-page time may show that the user was engaged while he viewed the 75% of the article. So, this explains the use of this metric in conjunction with total on-page time.
Number of social shares
Nowadays, there are several social media platforms like Twitter, Instagram, Facebook, Pinterest, Whatsapp, to name a few. And it’s through these mediums that the content becomes viral. The total count of social engagements (likes, re-tweets, mentions etc.) is an excellent measure for engagement.
Selecting the right engagement metrics is critical. A common mistake here is to select content performance metrics rather than ones meant for tracking content engagement. The distinction here is that the former measures response to specific calls to action while the latter relates more to how your content pushes prospects down the funnel.
Number of internal link clicks
If a user is engaged with your content, he is likely to hit click on internal links that point to other content assets. Hence this metric shouldn’t go ignored while evaluating your content engagement score. You should embed internal links in the content to other relevant assets. For example, the topic cluster approach involves putting internal outbound links in child assets and which point to pillar content for a given content topic.
Clicks on outbound links
The number of clicks on outbound links is a good indicator of content engagement scoring as it tells you that your audience trusts on your referred link and is keen to engage with your prescribed content. It clearly shows that your audience has trusted your content and speaks of a relationship with the brand.
E-mail sign ups
This metric is an excellent indicator that your audience wants to keep coming back to you and wants to engage with your content. If readers sign up for your e-mails, then we can surely say that the audience has found a connection with you through your content.
Notice though that this metric needs to used with a pinch of salt. Counting the number of people who subscribed to your newsletter is okay as the objective here is to increase exposure to your content. However, counting the number of people who fill up a sales lead form may be better suited as a performance rather than an engagement metric.
Exit rate
This metric is different from the bounce-back rate. It is the percentage of how many visitors leave your site after a particular page. Every page on the website will have a specific exit rate, but if some pages show exceptionally high exit rates, then it needs further attention. You need to check out those pages and try to make the content on those pages more captivating. Your audience should want to read and engage with most of your content.
Video view-through rate
The View Through Rate (VTR) is an important metric when a video is a part or all of your content. It tells you the percentage of people who completely saw your video compared to the ones who started viewing it. For example, if a user has liked your thumbnail, he may click on the video at once. But if he is not getting quality content in the video thereafter, he will decline and may exit the video, which is not what we want.
2-Normalizing metric values
While having the right metrics is a good start, by itself this is not enough to develop a tangible content engagement score.
Suppose you wish to compare the performance of a video with that of a blog post. Video performance is measured using metrics like the number of plays, percentage viewed, etc. Blog posts as judged based on average time on page. How do you compare the two?
| METRIC | DATA POINTS NEEDED TO CALCULATE | WHAT IT MEASURES |
|---|---|---|
| Lead Velocity Rate | No of Leads per marketing channel | Rate of leads generated from each channel |
| MQL / SQL Ratio | No of Marketing qualified leads No of Sales qualified leads | Rate of conversion from marketing qualified leads to sales qualified leads. |
| Lead Conversion Rate | No of trial signups / no of leads | Rate of converting leads to trial customers |
| Trial to paid conversion rate | No of paid customers divided by no of trial customers | Rate of users converting from trial to paid subscriptions |
You do this using a technique called normalization. Mainly, we convert different metrics into a numeric value based on a universal scale.
For example, if the maximum value for the number of video plays is 600, then we could consider 600 as being equivalent to 100 (the top end of the universal scale). A value of 400 would then translate into a score of 66.66, while a value of 10 would mean a score of 1.66.
Repeating this for the average time on page metric would also result in a score between 100 and 0, and we now have different metrics available for comparison using the same scale of measurement.
3-Assigning weights to metrics
Consider a 3000 odd word tower post that you wrote on a highly technical topic and which implements links to various other content items on your site. The tower post itself has little takeaway as it merely acts as a consolidated collection of the multiple links to individual child assets. Your real show of domain expertise is in the child assets, and that is what you want your visitors to see. In this case, the number of link clicks to child assets is probably more indicative of the right kind of engagement than just dwell time.
Bringing it all together
The due diligence above, if done correctly, should allow you to develop a numerical equation representing the score of each content item in your inventory. A simple example would be something like this
Content score = (∑ wt X normalized score)/number of metrics
Using this formula, you can objectively and consistently compare different content assets on their effectiveness in generating engagement. There is no subjectivity, and the recommendations you produce will be based on actual data. Moreover, this does not have to be a repetitive, manual exercise done on an ad-hoc basis or whenever you audit your content. Automation is critical here.
For example, the Syptus content audit platform allows you to track Google Analytics events against individual assets.

The number of such events is then used to calculate an objective score that you can use to compare across your entire inventory.